Web Platform for Student Projects
15.02.2023Analyzing the Popularity of Street Segments for Cyclists in the SimRa Dataset
As part of my bachelor thesis "Analyzing the Popularity of Street Segments for Cyclists in the SimRa Dataset" under Prof. Dr. Bermbach, I implemented an extension for the existing SimRa analysis platform. SimRa collects data about near miss incidents of cyclists and analyzes the collected data to discover insecure street segments.
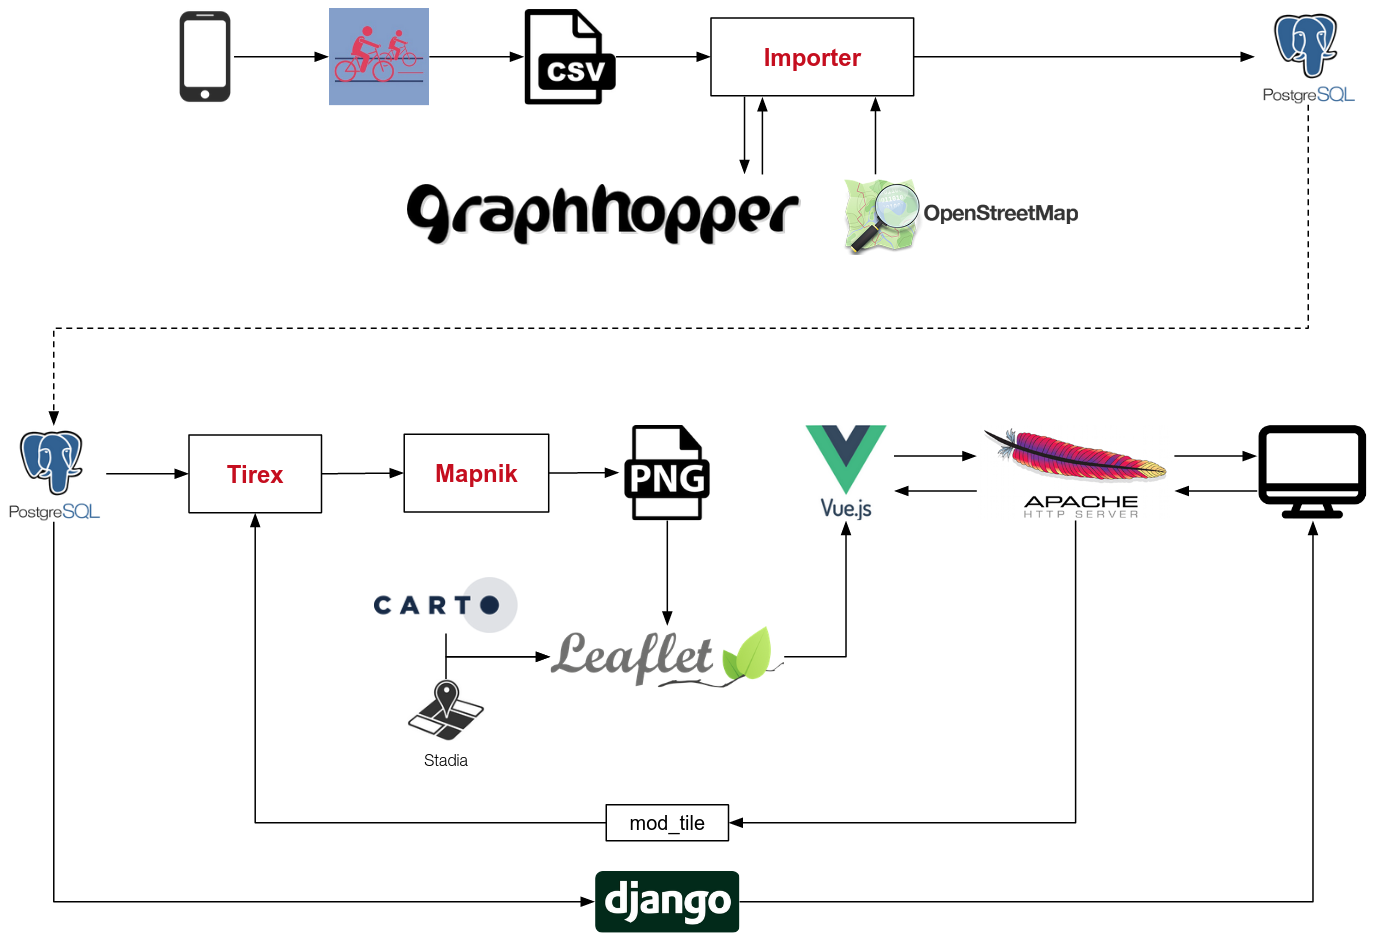
As part of my thesis I developed an approach to determine the popularity of street segments, based on two scores. The popularity score reflects a combination of avoided and chosen street segments (legs). The mixed popularity score additionally includes a safety score, which is derived from (non) scary near miss incidents. I extended the existing SimRa visualization software by additional application logic to allow the calculation of those scores for each street segment in an automated way. By providing eight different map views, I also allowed for a visual evaluation of the findings. Beyond the proposed software extension, my contributions included an extensive documentation of the project and first analytical insights into the street network popularity of Berlin, based on the SimRa dataset.
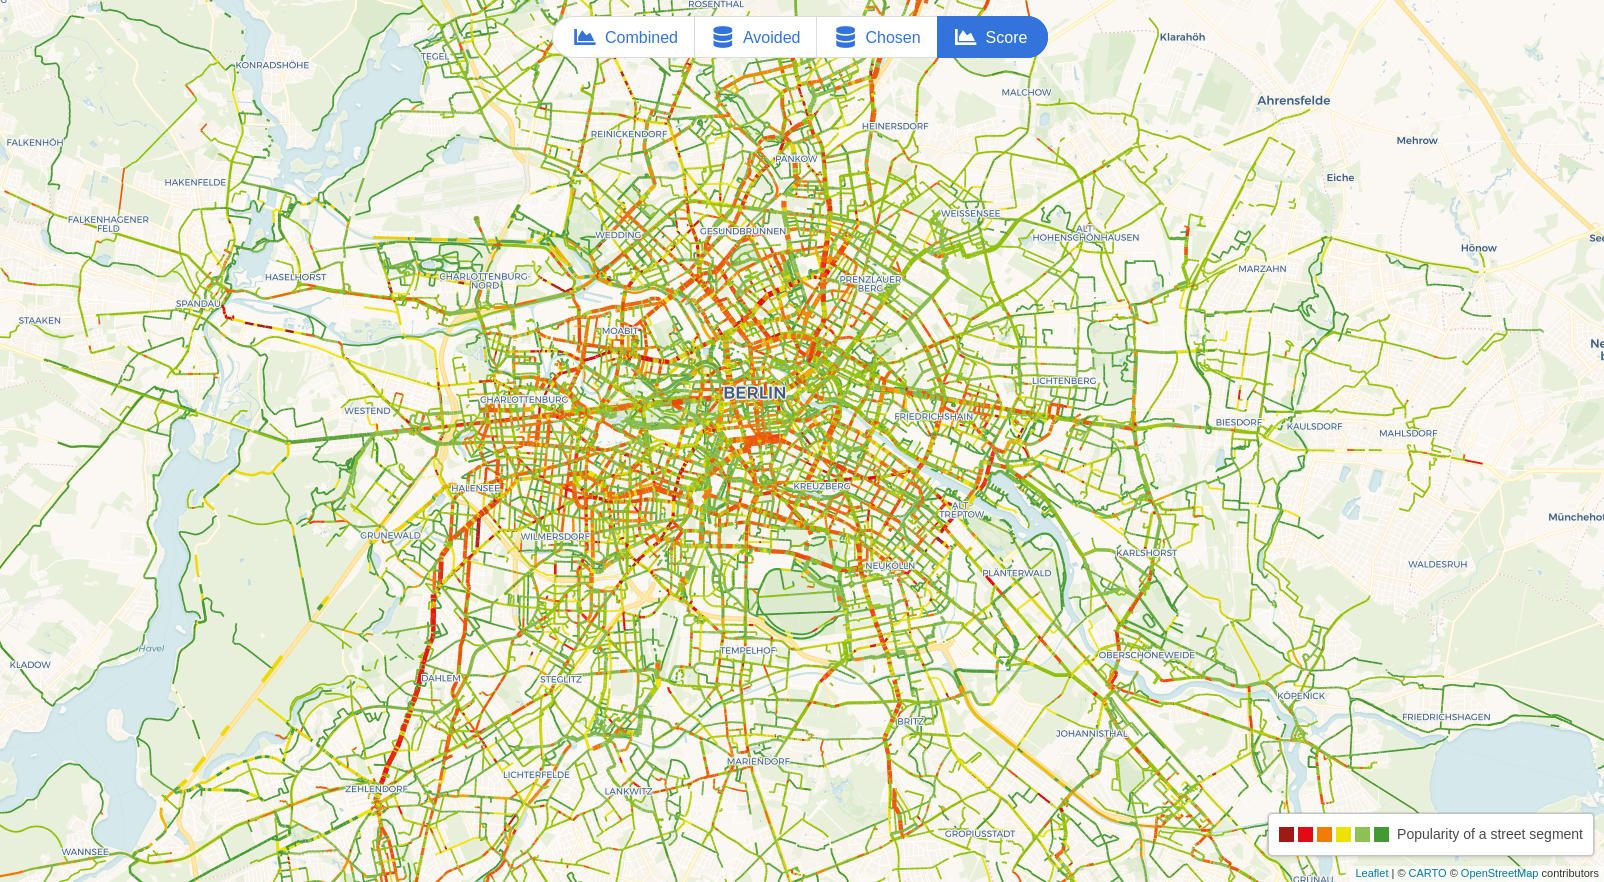
To visualize the distribution and structure of street segment popularity in any region, four categories of maps have been implemented:
- Combined: This map depicts the popularity score, consisting of avoided and chosen street segments.
- Chosen and Avoided: Those two maps visualize the aggregated distribution of chosen and avoided street segments throughout the region.
- Mixed Score: This map depicts the mixed popularity score, which is a combination of the popularity and the safety score.


